Latest Features
How To Calculate the Risk Of Pulmonary Oxygen Toxicity
Most tech divers track their oxygen exposure on big and or long dives via computer using methods, such as REPEX OTUs, developed in the 1980s. The consensus among researchers, however, is that these methods aren’t accurate. Enter retired Israeli hyperbaric physiologist, Ran Arieli, who offers a new data-driven method for computing your risk of pulmonary oxygen toxicity.

By Ran Arieli
Header image by Sean Romanowski
Hyperbaric oxygen (HBO) is an intrinsic facet of diving. However the risk of pulmonary oxygen toxicity (POT) has become a prominent issue due to the expansion of diving techniques, which include oxygen-enriched gas mixtures and technical diving. But there is still no satisfactory, practicable method of calculating the cumulative risk of oxygen toxicity during an HBO exposure.
The concept of the Unit Pulmonary Toxic Dose (UPTD), which is based on a modification of the rectangular hyperbola, was proposed in response to a request for oxygen exposure limits based on a very small amount of research data: a point at 4 bar and the absence of known injury at 0.5 bar (Lambertsen, personal communication). However, this was merely descriptive, and not based on any physical-chemical-physiological mechanism. The NOAA REPEX method, originally developed by R.W.”Bill” Hamilton in the 1980s, is based on a simple linear assumption without sufficient research validation. It is well accepted that both of these methods are inaccurate.
Because any chemical reaction, including the production of reactive oxygen species (ROS) and reactive nitrogen species (RNS), can be described by a polynomic expression, we chose the power law approach. Having incomplete knowledge of the reaction, we assumed that the rate of development of oxygen toxicity is related to the highest power of the PO2. When the various oxygen toxicity parameters such as a decrease in lung capacity, reduced hypoxic ventilatory drive, changes in skin conduction, or increased thickness of the alveolar wall, among others, are modeled as a function of exposure time, the result can best be expressed as a quadratic equation.
The rate of production of hydrogen peroxide (a precursor of ROS and RNS) is also related to the square of time, which can explain this time relationship. The power equation was shown to have good predictive capability.1,2


Deriving The Power Equation
From the above considerations, it follows that the development of oxygen toxicity should be related to the square of the exposure time (t) and to some power of PO2 (PO2c).
Initially, we derived the power equation for the loss of vital capacity (VC), with the addition of a parameter to adjust for the units:
%ΔVC = 0.0082 × t2 × (PO2)4.57
The predictive capacity of the power equation compared with the UPTD concept is shown in the following figure. At a PO2 above 1 bar, the UPTD concept fails.

It has been found that the recovery of VC (at a PO2 < 0.48 bar) has the form of an exponential expression, where the time constant increases linearly with the oxygen pressure of the previous exposure, as seen in the following figure.
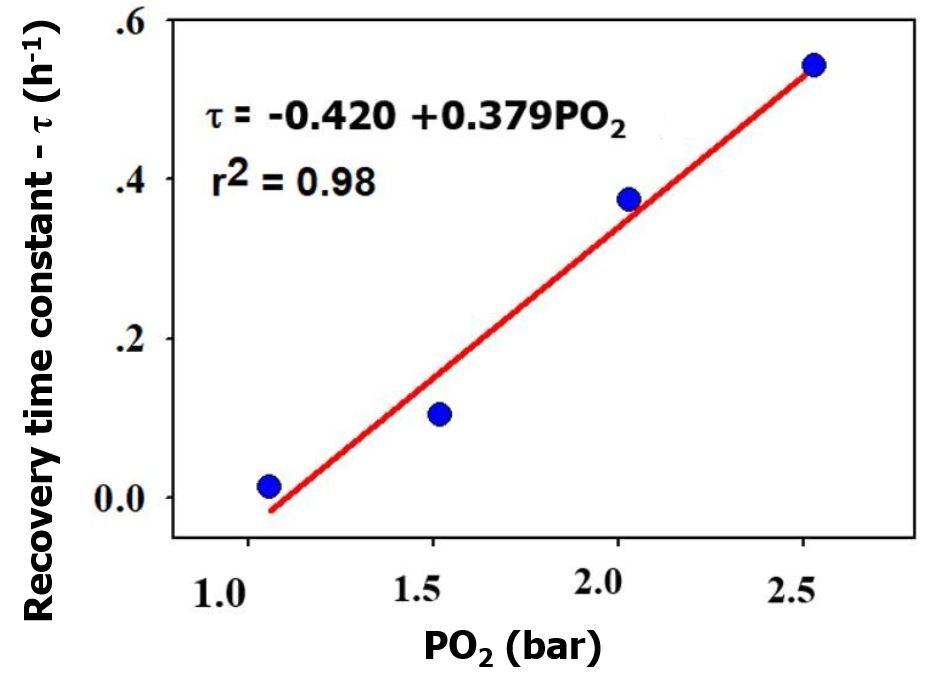
It was demonstrated that the pulmonary pathology is different at high and low PO2, that is, they represent distinct pathologies. With exposure to an increased PO2, central (cerebral) effects on the lung are greater than the local pulmonary effects of HBO. Thus, exponential recovery of pulmonary oxygen toxicity took the form:
ΔVCtr% = ΔVCe% × e – [- 0.42 + 0.384 × (PO2)ex] × tr
where tr is the recovery time in hours, ΔVCtr is the value after the recovery time, ΔVCe is the value following the previous hyperbaric oxygen exposure, and (PO2)ex is the previous exposure to hyperbaric oxygen in bar. The rate of recovery depends on the PO2 which caused the insult, and occurs with exposure to a PO2 > 1.1 bar.
A recently published study proposed other parameters to replace the changes in VC as an indicator of POT: incidence of symptoms (inspiratory burning, cough, chest tightness and dyspnea) and a change in pulmonary physiological parameters (FVC, FEV25-75 , FEV1 and DLCO). Because the units of the POT index [t2 × (PO2)4.57] are squared for time and the powered PO2, this index can also accommodate estimates which employ the other parameters. The incidence of POT in 16 different HBO exposures conducted at the U.S. Navy Experimental Diving Unit (NEDU) is plotted in the next figure as a function of the calculated POT index.

Thus, the POT index can be used to predict the incidence of POT:
Incidence (%) = 1.85 + 0.171 × POT index (1)
Calculations
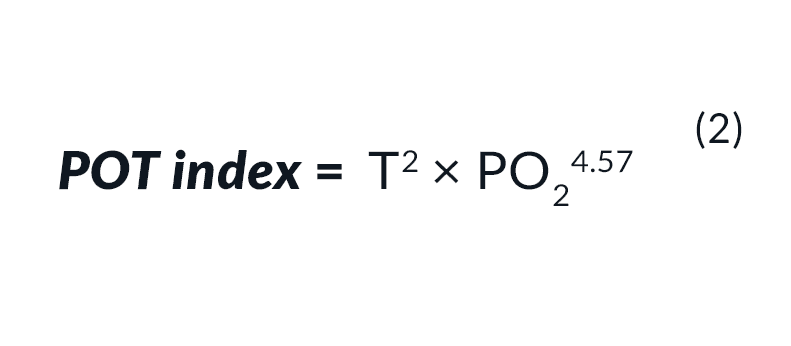
For the accumulation of toxicity at a PO2 above 0.6 bar use Eq. 2:
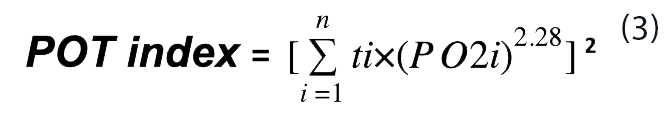
For a number of periods (n) of continuous hyperoxic exposure, each for a different length of time and at a different PO2, the calculation should take the form of Eq. 3.
During recovery at oxygen pressures below 0.50 bar, Eq. 4 is used.
POT index tr = POT indexe × e – [- 0.42 + 0.384 × (PO2)ex] × tr (4)
where tr is the recovery time in hours, POT indextr is the value after the recovery time, POT indexe is the value following the previous hyperbaric oxygen exposure, and (PO2)ex is the PO2 in the previous exposure in bar.
When there is a recovery period in between the hyperoxic exposures, the POT index at the end of recovery should be calculated from Eq. 4. The time required to obtain the same POT index for the next PO2 (PO2nx) in the following hyperoxic exposure will then be derived by rearranging Eq. 2 thus:
t* = [POT index / (PO2nx)4.57)]0.5. (5)
This calculated time t* should be added to the time of the coming hyperoxic period, as if the whole exposure started at this PO2. Thus:
POT index = (t*+tnx)2 × (PO2nx)4.57 (6)
The U.S. Navy recommends oxygen exposure limits that will result in a 2% change in VC, the maximum permissible exposure being expected to produce a 10% decrease. Thus, inserting ΔVC = 2% or ΔVC = 10% into the power equation will set the PO2 and time limits. For these two values of ΔVC, the POT index should not exceed 244 and 1,220, respectively, both at a constant pressure and for a complex exposure. We propose that the POT index be used to replace the UPTD or REPEX methods.
In summary, one may either employ the POT index limits of 244 (mild) to 1220 (exceptional), or determine the appropriate chosen risk from the incidence equation: Incidence (%) = 1.85 + 0.171 × POT index
“In summary, one may either employ the POT index limits of 244 (mild) to 1220 (exceptional), or determine the appropriate chosen risk from the incidence equation: Incidence (%) = 1.85 + 0.171 × POT index.”
Saturation Dives
Ed. note: Saturation diving has become a main modality for commercial diving (see: “Anatomy Of A Commercial Mixed Gas Dive”). Though it is not directly relevant for technical dives, it is remarkable that Arieli’s model spans the gamut from bounce dives to saturation. Mind those PO2s!
In principle, no threshold was incorporated in the power expression, which operates when ROS and RNS production overpowers the antioxidant activity that induces recovery. It was suggested that in prolonged exposures with a relatively low PO2, for example in saturation diving with a PO2 of 0.45–0.6 bar, a recovery process for POT accompanies the development of toxicity to attenuate but not entirely eliminate the toxic outcome.3
In one report of an experimental chamber saturation dive lasting 261 hours with a PO2 of 0.5‒0.6 bar, 2 of the 8 subjects (25%) developed POT. The POT index for 25% amounts to 136 (from Eq. 1). To adjust for these two opposing effects of cumulative toxicity and the recovery process, the following equation may be used:
POT index = t2 × PO24.57 × e-0.0135 × t (7)
where t is the exposure time to a toxic level of hyperoxia in h.
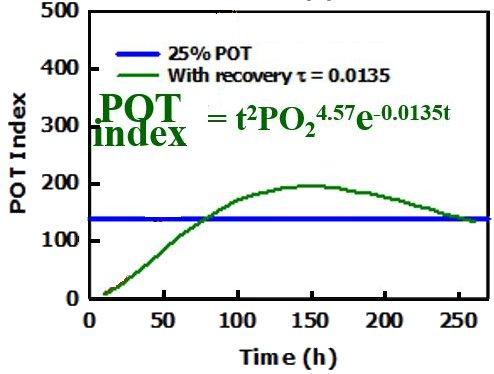
Evidently, eight dives are an insufficient sample. However, after the publication of reference #3, I obtained a further set of eight saturation dives. These divers dived for 4 days at a PO2 of 0.6 bar. Half of them suffered POT. The calculated percentage using Eq. 7 and Eq. 1 yielded 43.6% – rather close to the 50%. I would therefore recommend the use of Eq. 7 and Eq. 1 for long saturation dives with a PO2 close to the lower range of toxicity and above 0.48 bar.
References
1. Arieli R, Yalov A, Goldenshluger A. Modeling pulmonary and CNS O2 toxicity and estimation of parameters for humans. J Appl Physiol. 2002;92:248‒56. doi: 10.1152/japplphysiol.00434.2001. PMID: 11744667.
2. Arieli R. Calculated risk of pulmonary and central nervous system oxygen toxicity: a toxicity index derived from the power equation. Diving Hyperb Med. 49: 154-160, 2019. doi: 10.28920/dhm49.3.154-160. PMID: 31523789
3. Arieli R. Pulmonary oxygen toxicity in saturation dives with PO2 close to the lower end of the toxic range – a quantitative approach. Respir Physiol Neurobiol 268: 103243, 2019. doi: 10.1016/j.resp.2019.05.017. PMID: 31158523.
Dive Deeper:
Note that respiratory physiologist Barbara Shykoff, US Navy Experimental Diving Unit (NEDU), has also developed a model for estimating risk of pulmonary toxicity (2018): Calculator For Estimating The Risk of Pulmonary Toxicity
Shearwater Research: Why UPTD Calculations Should Not Be Used by Barbara Shykoff, 2017
Shearwater Research: Oxygen Toxicity Calculations by Erik C. Baker (2012). Explains earlier UPTD and REPEX calculations.
Tolerating Oxygen Exposure by RW Bill Hamilton, 1997
RW Bill Hamilton’s Original REPEX paper: Tolerating Exposure To High Oxygen Levels: Repex And Other Methods by RW Hamilton, 1989
An early 1985 review of the UPTD Model: Predicting Pulmonary O2 Toxicity: A New Look at the Unit Pulmonary Toxicity Dose by AL Harabin, L.D. Homer, PK Weathersby and ET Flynn
Ed. note: We plan to run an article discussing and comparing these various methods for calculating the risk of pulmonary oxygen toxicity in a coming issue of InDepth, including some practical tips for calculating the risks of your own dives.


Dr. Arieli is the retired Head of the Hyperbaric Physiology Research Unit at the Israel Naval Medical Institute. He obtained his Ph.D. from Tel-Aviv University, completing a post-doctorate at Buffalo, The State University of New York. He lectured in respiration physiology at the Technion Faculty of Medicine in Haifa. His main topics of research are respiratory physiology, integrative physiology, oxygen toxicity, and decompression physiology. Dr. Arieli has investigated the environmental factors which affect oxygen toxicity, proposing algorithms for the prediction of pulmonary and central nervous system oxygen toxicity. In his research into decompression physiology, Dr. Arieli has presented a new mechanism underlying bubble formation on decompression. Dr. Arieli has published 128 research papers, and continues to pursue his research at the Israel Naval Medical Institute in Haifa and the Western Galilee Medical Center in Nahariya, Israel.


Dial In Your DCS Risk with the Thalmann Algorithm

Deep Tunnel Workers Go Trimix

La Grande Dérive

California Dreamin’

British Invasion—Thailand Karst Edition 2024

Harnessing the Power of ‘Educated’ AI to Improve Diving Safety